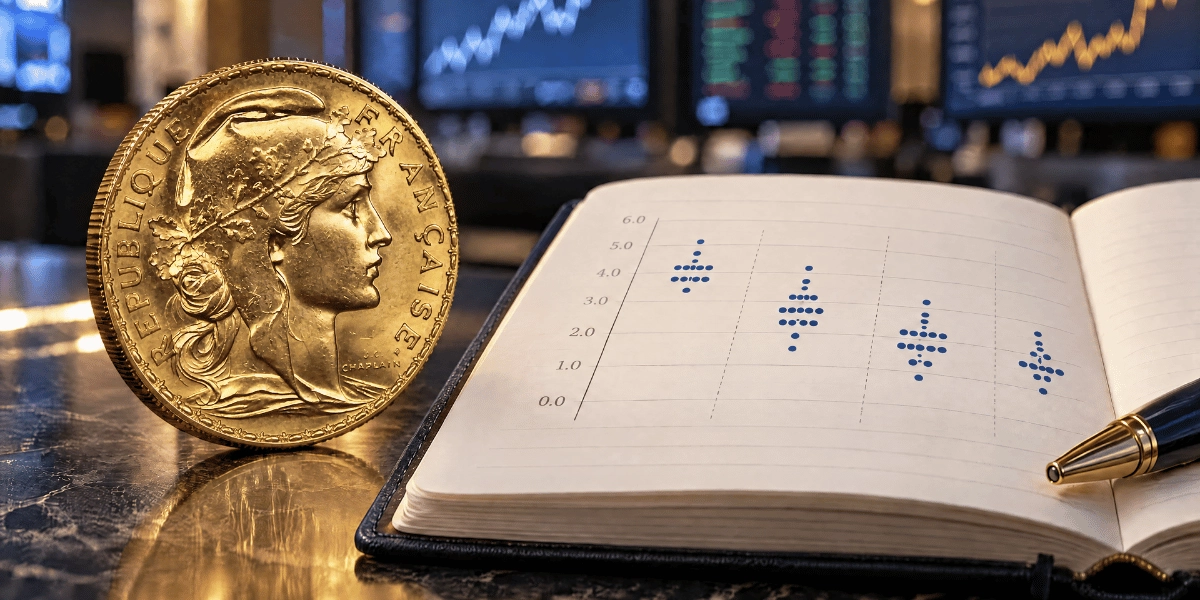
After every Fed meeting, investors first look at the interest rate decision. That makes sense. But to understand the link between the Fed and gold prices, that’s not the whole story. The meeting on September 15 and 16, 2026, provides a good example. The U.S. central bank raised rates by 25 basis points. However, the most important message may lie elsewhere: in the FOMC projections and the famous Fed dot plot.
The “dot plot” is a chart that summarizes monetary policymakers’ expectations for future interest rates. It guarantees nothing. But it influences the markets because it provides an indication of how long monetary tightening will last. For physical gold, this is essential. Gold pays neither interest nor dividends. Its appeal therefore depends on U.S. real yields, the dollar, and the Fed’s credibility in the face of U.S. inflation.
Key Takeaways from the Article
- The Fed’s September 2026 decision raised the benchmark interest rate by 25 basis points to 3.75%–4%, according to the FOMC statement released by the Federal Reserve.
- The Fed’s dot plot is more important than today’s rate, as it indicates the likely path for the coming quarters.
- The price of gold following the Fed’s decision depends primarily on U.S. real yields, the dollar, U.S. inflation, and the central bank’s balance sheet.
A Rate Hike That Doesn’t Tell the Whole Story
On September 16, 2026, the Federal Reserve announced a 25-basis-point rate hike. The target range for the federal funds rate rose to 3.75%–4%. In its FOMC statement, the central bank described an economy that remains strong, resilient domestic spending, and persistently high inflation. The vote was unanimous.
On paper, this type of decision can weigh on gold. When rates rise, bonds become more attractive. The opportunity cost of holding gold therefore increases. But the market reacts primarily to the gap between what was expected and what was announced. MarketWatch reported on September 16 that gold was rising despite expectations of a rate hike.
Why Is the Fed’s “Dot Plot” Becoming Central?
The Fed’s dot plot is a roadmap. Each dot indicates the interest rate level deemed appropriate by a committee member for the coming years. It is not a promise. The Fed can change its trajectory if employment slows, inflation falls, or market conditions become strained. But this document remains valuable because it reveals the FOMC’s center of gravity.
In the September economic projections released by the Federal Reserve, the median fed funds rate stands at 4.1% for 2026, 4.1% for 2027, and 3.9% for 2028. In June, the projections were lower: 3.8% for 2026, 3.6% for 2027, and 3.4% for 2028. The signal is clear: The Fed expects to maintain a restrictive policy for a longer period.
For gold, this information may matter more than the 25-basis-point hike itself. If the market believes the hike is a one-off, its impact may be limited. If the dot plot suggests high rates for several quarters, real yields may remain under upward pressure.
Real Yields, Inflation, and the Dollar
Gold does not react solely to nominal interest rates. It reacts primarily to real yields—that is, bond yields adjusted for expected inflation. If interest rates rise but expected inflation also rises, the real yield may remain stable. In this case, gold retains some of its appeal.
The situation becomes more complicated if the Fed convinces the market that it can control inflation while maintaining high interest rates. Real yields then rise. U.S. bonds become more competitive again. The dollar may strengthen. Gold, an asset that generates no income, comes under greater pressure.
FOMC projections show U.S. inflation still above target. The median PCE inflation rate is projected at 3.7% for 2026, then 2.3% for 2027. Core PCE is projected at 3.4% in 2026. This mix is ambivalent. It justifies a hawkish Fed, but it also fuels the need for protection against monetary erosion.
The dollar remains one of the most visible links between U.S. interest rates and gold. When interest rate projections rise, the U.S. dollar may strengthen. Since gold is priced in dollars, it becomes more expensive for European buyers. For a French investor, the price paid therefore depends on the global price per ounce and the euro-dollar exchange rate.
The Fed’s balance sheet: an often-overlooked variable
The Fed’s balance sheet may seem technical. Yet it influences the liquidity of the financial system. A central bank that rapidly withdraws liquidity can push yields higher. A central bank that maintains ample reserves sends a less abrupt signal. The FOMC statement specifically indicates that the Fed is pursuing a policy of ample reserves.
For gold, the combination of factors is more important than any single variable. High interest rates, a strong dollar, and rising real yields create a challenging environment. Persistent inflation, weaker growth, and monetary uncertainty, on the other hand, can support demand for safe-haven assets.
What should individual investors do?
Following this September 2026 Fed decision, two mistakes should be avoided. The first is to automatically conclude that a rate hike is bad for gold. The second is to ignore the hawkish signal from the dot plot. The right approach is to monitor several indicators together: U.S. real yields, the dollar, inflation, Fed statements, and balance sheet trends.
Physical gold should not be evaluated like a bond or a yield-oriented stock. Its primary role is to diversify a portfolio. It can protect against certain shocks, but it can also experience periods of consolidation when real yields rise. The rate decision sets the tone. The dot plot often dictates what happens next.
Conclusion
Understanding the link between the Fed and the price of gold requires looking beyond the immediate decision on interest rates. The dot plot sheds light on the intentions of monetary policymakers, but its significance depends on trends in inflation, real yields, and the dollar. The central bank’s balance sheet provides further insight. None of these signals, taken in isolation, allows for a certain prediction of gold’s trajectory. For investors, the key is therefore to view market reactions from a longer-term perspective. Physical gold retains its place in a diversification strategy, though investors must be prepared to accept fluctuations. Upcoming economic data will help determine whether the path envisioned by the Fed is on track.
By La rédaction Godot & Fils
Passionate and expert in the field of buying and selling precious metals, we put our expertise at your service to offer you in-depth analyses of gold and silver financial news. Driven by the desire to provide you with clear, reliable and relevant information, we ensure that each piece of content is both precise and concise. Our aim is to help you better understand market trends so that you can make informed decisions about your investments. Through our articles, we offer practical advice, decoding of major economic events and technical analysis to maximise your investment opportunities. Whether you are a beginner or an experienced investor, our content is designed to help you succeed in your precious metals investments. Follow us so that you don't miss out on any market developments and benefit from an expert's view of gold, silver and the economic dynamics that shape their value.
Receive the latest news by subscribing to the newsletter


 50 French Francs


 Walking Liberty 1 once Silver